Within Portal 2.0, one is able to create custom dashboards to view real-time data for the sensors and devices that are important to you.
One can view custom dashboards by going to the dashboard tab for a room within Portal 2.0. Viewing historical data via charts has been moved to the ‘Analytics’ tab within the room dashboard.
By default, the dashboard displays all sensors assigned to the room with individual charts displaying the last hour of sensor data, grouped by the sensor module: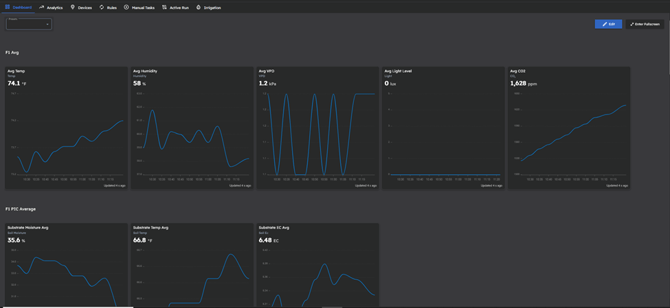
However, one can create a Custom dashboard by clicking the presets drop-down in the top-left and clicking ‘Add New Preset’, then giving the Preset a name. This creates a blank space where one can then add desired Sensors, Devices, Manual tasks, and applicable headers to create a custom dashboard that fits your use case and needs:![]()
To add sensors, click the edit button in the top right, then click the sensors drop-down, select the desired sensor data to display in the dashboard, then hit the ‘Add’ button in the top of the page.
To add Devices, click the Devices drop-down, select the desired devices to display in the dashboard, then hit the ‘Add’ button in the top of the page.
To add Manual tasks, click the Manual Tasks drop down, select the desired manual tasks to display in the dashboard, then hit the ‘Add’ button in the top of the page.
To add headers to neatly label and separate sections, click the ‘Add Header’ button to create a text block.
All sensor data charts, devices, manual tasks, and headers are able to be resized by dragging a border of the sensor or device to increase or decrease its size: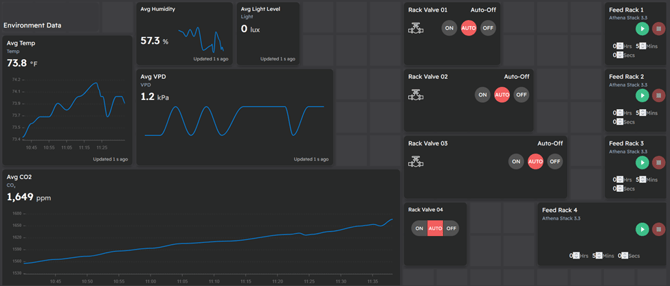
All sensor data charts, devices, manual tasks, and headers are able to be moved around the dashboard by clicking the top border and dragging the object to the desired location.
One can make the page full-screen in your browser by tapping the ‘Enter Fullscreen’ button in the top right of the dashboard: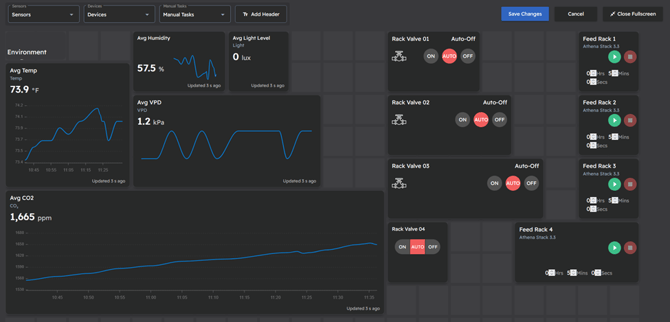
Once the desired custom dashboard has been generated, click ‘Save Changes’ to save your preset and configured items on that dashboard.
Lastly, in the Preferences tab within Portal 2.0, one can specify if clicking on a room card defaults to this new custom dashboard tab, or defaults to the old dashboard for viewing historical data (now named the Analytics Tab):
A video walk through of creating and using Custom Real Time Dashboards can be found below: